Legend
🔥 Multi-timeframe detail
🚀 Clear trend
🥔 Grindy/rangebound
😵 Confusing
🕓 Time-warp (advanced)
👶 Beginner friendly
Beautiful trade on AAPL today to 1 ATR. And it kept going!

Made it all the way to 1.618 ATR! 2nd Golden fib. 😍 Didn't leave runners on this, but perhaps I could have. I generally am VERY happy with a 1 ATR move.

Quick scalp on this one.

This was yesterday. Just fyi.
Didn't work out how I wanted! But green is green.
AAPL 162.5p Trade Recap 08-04-2022

Solid trade. Bread and butter. Break of resistance and the opening range.

AMZN 143c Trade Recap 08-04-2022
Quick lotto scalp in momentum.

SPX 4145p Trade Recap 08-04-2022
Good trade today. Should have held on much longer. Hope some of you took this one.


Trade recap of my 400p and 396p trades that we took live. Nice trade. Glad many of you got a piece of this and we could discuss it live together.
Pre-market everyone and their mother was watching this bear flag on ES / SPX / SPY


I mentioned before open that I was looking at 400p as my strike for SPY and was loaded.

Just before open, I looked at the 10m chart to see if our trend was holding. We had clear trend. The conviction arrow had fired and we were approaching a bear flag breakdown.

I also noticed we were in a low squeeze on the 10m and a high squeeze on the 3m. So there could be some momentum coming into the open.
There were a lot of signals that gave me enough conviction to take the trade before my usual 10m rule and use a tight stop above the call trigger to cut it if it went against me.
We got in around 4-5 min into the open.
Trade worked out and we captured profit along the way. Some held all the way through. I got out earlier than I should have, but ended up getting into 396p for another 100%+. So it all worked out. As I say, there is ALWAYS another trade. 🙂

Very quick scalp on this one.

I always exit 100% on lottos. 3 was a pre-determined exit
Recap of the first trade I did live on Friday.

Set up was this falling wedge (shown on the 3m ES chart). You can see it above in the SPX chart as well, but it's not nearly as apparent.

Quick trade recap on my morning puts trade in trend with momentum.

Nice trade off call trigger support after the morning rip and then chop. The thing that kept me interested was the fact that the ribbon on the 10m had a nice trend.

This was a pure lotto. 0 or hero. I was willing to lose the entire principal. 100% risk.
Ended up being a monster play.

This was mostly luck. But the 4000 psych level + the break of this descending resistance and bounce off the scalp call trigger (which was holding support throughout the afternoon) made me feel the probabilities were better for up than down.

Just an example using the contract we had from the announcement today.

You could have taken it at the break of the trendline as well.
However this example shows you how to use the ribbon as technical resistance to stay in the trade
Stop could have been above the put trigger or close above the 34
This was mostly luck. Was not expecting more than a double. But it worked out nicely.

Trade recap from our EOD lotto

In retrospect 3690c was a more elite pick
Trend is friend.

Here's an example of taking an Opening Range Break on today's SPY breakdown. 364p was the contract selection from <#989999806103580763> today. 360p (the dump contract selection would have worked too).

Here's a discussion of the SPY trade we took together live. We had the opportunity to trade it multiple times for 50% in the ribbon. If you held beyond that, it went big all the way to +1 ATR for a multibagger. Then there was another opportunity to get in. I exited before the big move. I got back into 365c later on the dip to the ribbon with the descending wedge setup in clear 10m trend. Hope this helps.

Another perspective. If you had use the conviction arrow on the 3m, the pullback entry with Squeeze confluence was solid.

I have been watching the 30m more frequently this past few weeks as all of you know. I was watching it this afternoon.

With the 30m ribbon holding, I jumped into the 10m to take care of business.

2 scalps on 400c 11/4.
One was from adds on overnight runners.
Second was a dip buy reversion before the 2nd dump.
Hedged it with 365p 11/4, which also ended up profitable.


Here's the example from today of where I mentioned on live to get into puts. I didn't take this trade since I already had the hedge in place.

Also something I noticed after the fact looking at the Unusual Whales Market Overview page. Reviewing the daily tide. Massive premium divergence started at that big green candle where the conviction arrow fired on the 10m. Nice additional point of conviction. Will start watching this more carefully real-time.


In case you missed the initial conviction arrow signal, here are a few more opportunities to enter a clean trend trade like this.
Exits not shown, but would as usual be at ATR levels, key levels, or intraday support.
Got into this one live with you. Super fun. Congrats! Here's my recap.


Ran as far as the 1st extension. Beautiful move.

Here's our plan from today and how you could have played it.


Here was the plan and the pre-open adjustment (where 383c was suggested as an alternative to 380c)


Entries

Here's the plan from the morning

And the recap


Relevant excerpt on fading the tick. And the extreme tick readings from this morning

Here's this morning's plan. We were looking for a break of the previous close with an initial move to the call trigger, which was just after our 389 ITM target.

3m candles with 10m ribbon time warped shown here. Had a few things going for us. Nice bullish volume pre-market. Held pre-market support. 3m squeeze. Then we had a small falling wedge setting up on the 3m. I took the break of the wedge, using a breakdown of the ribbon as my risk.

Here's a recap of my SPY 410p trade this morning.

Post from <#989999806103580763>


Recap of our trade we talked through live.
In the morning we were watching this bull flag on the hourly

Strikes were 412c for SPY or 4130c for SPX
Fun trade. Congrats!

Sorry my entry arrow is pointing correctly but the not at the correct candle. I got in at the 2nd 3m candle
Here you go
Recap from today's 437p play on live.
Here's the morning plan for reference.

Recap


2x scalps on 4495p plan strike off the put trigger (per plan). 2x scalps on 4425c plan strike off the ribbon and support.
Today's plan


Here's the morning plan for context. I traded SPX instead of SPY 449c, but SPY 449c would have worked great too for almost 100%.


SPX 4500c 100% Scalp Using the Morning Plan
Strike selections

Morning plan

Here's the recap. Same entry / exit would have worked with the plan strikes SPY 441c or SPX 4420c. Once we held the overnight low, 4H 13 EMA (also a FVG on ES) and started to form the iVomy, calls made sense.

SPY 441c or SPX 4420c Trade Recap (I traded 4425c from the Leaderboard)
SPX 4425c was climbing the leaderboard, so I used it instead of 4420c/4430c.
Our morning plan

My trade

Sorry removed the old one. Accidentally wrote 10m squeeze on the 3m chart
I was also looking at the 10m chart

And we had a 10m squeeze as well.
Hourly ribbon held all day

And we discussed in the morning the conviction arrow on the 4H (ES and SPY on tos) and H (SPX) with consolidation above the 4H ribbon. You can see the consolidation breakout.

Plan for the day for context

Recap of 4 trades
🟢 4865c
🟢 4840p
🟢 4865c
🔴 4860c

You could have taken this with just the flag as well. No leaderboard/gamma necessary. Although they helped with strike selection since that's where the volume was.


This was the morning plan for context


Trade Recap for the epic 5600c move.
Morning Plan for reference. 5600c was our upside strike


EOD

Trade Recaps for 5600c and EOD 5626c on 8/27
Here was our pre-market plan using the 10m.

Strike selections

Early Vomy Short Entry

50% Retracement Long

21 EMA Vomy Short

3m Divergence Long

Supply / 21 EMA Resistance Short

10m Divergence Long

Supply Resistance Short to Gap Fill Thursday

For context, the morning plan

Around 8:40 noted this prior supply that flipped to demand (support).

Looking for the mean reversion discussed on Sunday's post

For context here's Sunday's Hourly SPX analysis

So with all that in the back of mind, we took 2 trades of 5890c, one for a base hit off 4.50 and then the 2nd one which was our big winner.

Here's the SPX 10m chart as well showing that our thesis of 5900 test ended up coming to fruition.

And the hourly

And the SPY 4H

If you wish to revisit the notes for the trade they begin here: https://discord.com/channels/973956271390740491/989999806103580763/1307860663065903148
Recap of our trade this morning. 3/10 Timewarp.

This is the final composite view of Periscope, that shows the larget net-negative gamma levels I was using for resistance.

Main position for a double. Runners went to 150%.


Morning plan for context


10m chart showing the overnight demand

Morning plan for context


You can review the morning plan here: https://discord.com/channels/973956271390740491/989999806103580763/1387053086593515601
And the prior evening notes here: https://discord.com/channels/973956271390740491/989999806103580763/1386867120784015452
For direct context, the morning plan

6100c and 6050c trades

6100c 10m ORB trade. Note I normally wouldn't take this trade, My preferred is the 6050c trade above. But I wanted to show you what was possible.

For context here is the morning plan


You can also see the live notes starting here: https://discord.com/channels/973956271390740491/989999806103580763/1405537500138700841
This is my first time recapping using a 4x4 chart. Some things to note. The numbers are not chart specific, meaning they go in order regardless of which chart they are on. This is so I can keep continuity for you across multiple timeframes. Hopefully this makes sense. Let me know your feedback in chat.
The chart setup is like this
SPY 3m + Scalp Levels | SPY 10m + Day Levels
SPX 10m + Day Levels | SPY H + Multiday Levels

Here is the morning plan for context:


The background context is provided in this Weekly Pivot Video https://www.youtube.com/watch?v=YN8eYqFnKJA
We were live for most of this morning and early afternoon, but I tried to post in notes as well as I went along to keep those who were not on live in the loop. You can read the notes starting here: https://discord.com/channels/973956271390740491/989999806103580763/1407336847264317500
Here's the recap. By my own standards, I overtraded today. 1 (took) + 3 (didn't take for what could have been an all day hold) were the only trades really needed. Plus maybe one of the 2 EOD trades to complete a normal 3-trade max day.

Here is the morning plan for context:


You can read the real-time notes starting here: https://discord.com/channels/973956271390740491/989999806103580763/1408072834198011946
This video provide background context for the week: https://www.youtube.com/watch?v=YN8eYqFnKJA
These are 4 of the trades I took today. I had some smaller ones between the first 3 and the tick fade, but are not typical trades for me. TICK fade was opportunistic. I generally don't trade that time. Right time right place.

For additional context for this trade please review <#989999806103580763> starting here: https://discord.com/channels/973956271390740491/989999806103580763/1420090555093876777

Here's the gamma plan from UW Periscope for loss of 6670

Here's a recap of my STO 6600p | BTO 6550p put credit spread I sold for on average $700 per. Partials were taken along the way and remaining cash settled for full credit. This is a higher risk spread due to the width. In notes I recommended STO 6550p | 5-10w (or your risk choice) as a safer sub -2 ATR suggestion (similar to what we did the prior week)

Morning plan for context.

Real-time notes starting here: https://discord.com/channels/973956271390740491/989999806103580763/1480550486032777427
Some of you may have wondered why I keep getting the market pivots right! When I show you how I do it, you will be surprised at the simple way I do it! And now you can do it as well.
Here are today's pivot levels for example

How did I get these?
The process is insanely simple!
1. Find which Day Mode ATR Level is closest to the PA or is being interacted with.
2. Find the nearest psych level to the PA
3. That's your pivot!
VIX

SPY

For SPX, I use ES (futures)

This can be used on any ticker btw. I primarily use it on the indexes. But works on others!

Incase discord compresses it, here's the zip.

Long / Buy calls / Sell puts at support.
Short / Buy puts / Sell calls at resistance.

1. Find support and resistance that have lots of touches (wicks and/or bodies).
2. Within these supports and resistances should contain clusters of price respecting the range.
3. My preference is to start on a daily or 4H chart. If I start on a daily chart, I will refine on the 4H and H charts.
4. I will also review against M and W charts as levels there are stronger than on the Daily.
5. For short-term trading you can use this same method on lower timeframes (3m, 10m, etc.) and that can be relevant for day trades.
You can use this as a template for taking trades.

Remember don't wait to take profit. If the PA indicates it is going to change direction, you take your profit. The above profit targets are ideal.
Here is an example entry using today's morning plan
Moring Plan


Box formed between the call and put trigger. Often when price starts in the trigger box it can stay range bound for the day. This has to be formally tested. Example SPY from today.


Typically i'm looking for the most likely or cleanest support and resistance levels that "surround" the price action. If that makes sense. Let's use today's and yesterday's plans to describe this.
Today's plan we had strong resistance at -1 atr yesterday after hours which was roughly the previous close value. That remained in pre-market, so we had to break that level for any meaningful move. On the downside, I could have used the 50% level as well, but I felt a break of the midrange would likely unlock a bigger move probability-wise, so I used that level.
Yesterday's plan we had an after hours wick up to a clear level which ended up matching roughly where our call trigger was, so I liked that as level to go long since it was a defined upper resistance from the AH/PM level. We tried testing it again in the morning and failed below the call trigger. Then we had an ascending support that helped form a nice ascending triangle (usually bullish, which is why my initial bias was bullish). Break of that triangle gave us the massive trend play to the downside.
The general idea is to find key support and resistance where you think likely continuation will happen. Sometimes it can be two levels / box other times there may be a clear pattern. But usually you can put together something like this in 15-30 minutes. Maybe a bit longer when starting out.
Support/Resistance is the name of the game though. Find the levels/trendlines you think are critical for continuation.


Here's a cheat sheet so you know which level is which and some of the terminology we use when talking about ATR Levels.

Higher-res version
ATR Levels Levels and Pivot Ribbon Key Features Cheat Sheet
You can use the same method for trading a 15m ORB or 30m ORB, you'll just use slightly different timeframes for confirmation and entry. For 15m, typically confirm on 5m and enter on 1m. For 30m, you my confirm on 15m and enter on 1m or 5m.
I have been using 10m range for 3 years , so my preference is to use 10/3/1.
The basic steps:
1. Wait for 10m candle close
2. Mark High and Low of 10m candle
3. Switch to 3m.
4. Wait for 3m close above or below the 10m Opening Range
5. Switch to 1m.
6. Enter on pullback on the 1m noting s/r for risk back within the opening range.
7. Scale out at ATR Levels and/or Intraday supply & demand or support & resistance


One of the downsides of the ORB strategy is you will likely be getting a later entry than a ribbon or s/r entry.
The upside is that the trend move might be more established once the break happens and could lead to a more confident trade, albeit shorter.
Here's an excerpt from Martin Pring's TA bible

NFLX Gap examples

From John Carter's "Mastering the Trade"

This represents % of gaps filled on the same day they are created based on the day of the week.

Here's a cheat sheet for you on the Golden Gate Strat.

tesrak's Video explaining probabilities https://www.youtube.com/watch?v=MMf7T1cPquQ&t=84s


We've talked a lot about Vomy. He's even our discord mascot. Using today's downside move we caught on live, I put together this cheat sheet for you.

Using last night's price action as an example


Nice example today off the bull flag setup and breakout.

Same works for Candle Highs in a short setup
Also know to some and popularized as TGIF. The idea is pretty simple:
It's rare for a Weekly candle to not have a lower and upper wick. Using this information we can trade afternoons on a Friday with this in mind if certain conditions are met.
**Bullish Case @ Low of Week**
1. In the afternoon (after 2pm), price is close to the Low of Week.
2. Monitor for potential bullish setups into 4pm if we continue to stay close to the Low of the Week.
3. A move from Low of Week to create a wick on the bottom of the weekly candle is likely into close.
**Bearish Case @ High of Week**
1. In the afternoon (after 2pm), price is close to the High of Week.
2. Monitor for potential bearish setups into 4pm if we continue to stay close to the High of the Week.
3. A move from High of Week to create a wick on the top of the weekly candle is likely into close.
**Trend Change**
Trade Vomy
**Consolidation Breakout**
Trade the Squeeze
**Clear Trend**
Trade Pivot Ribbon, ATR Levels Probabilities, Golden Gate
**Extended**
Trade Mean Reversion

1. Strikes 1 ATR Level away
2. Take positions on level breaks and rejections
3. If candle breaks level with force, wait for retest
4. If candle gets too far away from ribbon, wait for pullback
5. Exit/scale out at resistance/next level
Original post on twitter: https://twitter.com/dreyonthemoon/status/1555892515596804096?s=20&t=vX8b0eV_pxtaGArOw2fmvg
A PDF of the Professor's education thread.
**Summary **
IV flush is an arbitrage play. People buy contracts thinking the price will move outside the expected move. Then it doesn't. Then IV deflates and people try to salvage their contracts as best as they can. As they sell them, if you are on the right side, then you can capitalize by playing middle man. Buy the IV deflated contracts and as volume pours in, premiums rise. As underlying is in your favor, premiums rise. Then you sell it.
**You can follow and subscribe to Nasa:**
X: https://x.com/TheRealNasa00?s=20
YouTube: https://www.youtube.com/@therealnasa0028/videos
**Nasa's YouTube Tutorials**
IV Flush Part 1:
https://www.youtube.com/watch?v=n8cjW1apwYo
IV Flush Part 2:
https://www.youtube.com/watch?v=9mQG0yVXq2E
IV Flush Part 3:
https://www.youtube.com/watch?v=_TWnczx1IiQ
IV Flush Part 4:
https://www.youtube.com/watch?v=7ALhYeK8r2U
Cheat Sheet for you

Conviction arrows fire when the 13 EMA crosses over the 48 EMA
When the 13 goes above the 48 you get an up arrow
When the 13 goes below the 48 you get a down arrow
When looking to enter a position, after a ribbon flip, indicating trend transition, if you get an arrow firing, look to enter on the next pullback to the ribbon. As long as price and volume (and other indicators you use) are not showing a possible change in trend, that pullback entry after the arrows should be high conviction.


**A cheap, easy, and predictable way to play a lotto trade: The End of Week Butterfly. **
Do you have a bias that the market will go a specific direction by the end of the week? Do you believe the SPX/SPY will settle on a big round number on Friday because markets like to do that? Do you have $5-10 dollars lying around and just want to sip on that sweet, sweet hopium? Then this trade is for you.
To be clear, this trade is based on technical analysis, but only so much. It’s a lotto trade, so position size accordingly. As mentioned above, this trade is based on the idea that markets typically like to settle on round numbers at the end of the week and market makers like to plank the price to destroy as much premium as possible (max pain). If you agree with this premise, you can typically find very cheap trades early and even mid-week on index funds (I prefer SPX because it’s cash-settled, meaning you do not need to produce the underlying stock when the contract is complete, but you can do this with any security, including SPY).
So, what do you do? The idea behind a butterfly trade (like any spread trade), is to finance one side of the trade with the other side. In the case of a call butterfly, you’re buying calls on either side or your target price, and selling calls at your target price. Let’s say you believe the SPX will settle at $4100 at the end of the week, you would buy calls at $4095 and $4105 and sell calls at $4100. This is the cheapest way to execute the trade because the strikes are very close to each other, but also means you have to be very precise with your end of week prediction. Typically, a trade of this type will be very cheap (as low as $5 total). The wider you make your strike choices, for example, 4050/4100/4150, the more expensive the trade will cost you, but the precision required to succeed will be lower.
To execute the trade, you go into the options chain and typically right click to select “Buy” and among the choices will be a “Single,” “Vertical,” “Iron Condor,” and in this case “Butterfly.”

Most platforms will default to the most precise strikes on either side of your target, but you can easily change them.
Once you’ve decided on your degree of precision, you select confirm and send, and you’ll be given a pop-up that will show you your max profit and loss. In the case of the trade above, if you can get a fill at $5-10 or so, you’ll be risk $5-10 to make $495.
Good luck out there!
Trading spreads was initially very intimidating to me, but as I’ve begun to understand their benefits, I now use them all the time. This post is going to cover one spread that I absolutely love, the Call Credit Spread (found under Vertical in some trading platforms).
**Benefits **
1. Incredibly fast in and out.
2. Cheaper to play than just selling/buying calls.
3. If you’re right, it’s worth 100% gain if the trade cash settles and your thesis is correct.
**Risks**
1. Incredibly fast in and out.
2. The Risk/Reward ratio can sometimes appear daunting because if your thesis is incorrect or you pick a suboptimal entry, you can lose quick a bit.
**How it Works**
The premise behind this particular trade is a bet that an outcome at the end of the day will NOT come true. You are effectively selling time to someone else and just running out the clock on them. If this was a basketball game, you’d be the guy dribbling the ball in the back court trying not to let the other team score or even gain possession. Haha.
The idea is that you’re selling one strike to finance the other strike. The strike you’re selling is more expensive than the one you’re buying, so if both strikes are out of the money at the end of the session, you net the balance between the two.
As with any trade, I use traditional technical analysis to determine my entries and exits, so this isn’t very different than a directional trade.
Let’s use an example from 8/31/22 that I made close to the end of the session. For the purposes on this demonstration, I’m going to be using the same prices I executed my trades at, but I’ll be using 9/1/22 in my screenshots because the trade is over.
**What Went into the Trade**
The entire day was a gigantic sell-off. There were nearly no bullish confirmations for the entire day, so I was looking for a headfake toward the end of the day, which is pretty common. The easiest way to detect this is with market internals. In this case, I was looking for the $TICK to pop up above 1000 and hang out there for a bit, then head back down. What this tells you is that algorithmic buying programs have kicked in and are attempting to turn the market from bearish to bullish. This happened around 3:15 EST. I normally don’t enter this kind of trade until the last 30 minutes of the session, but opportunity came knocking.
So, because I believed:
1. The SPX had hit +2 ATR on the 3 minute chart
2. The $TICK did not confirm bullish reversal
3. SPX was oversold on the 3, 5, and 15 minute chart
4. Squeeze was firing to the downside on the 3 and 5 minute chart
I decided to enter the trade with the idea that 3980 would not hold until the end of the day.
**Gray circle below was when I entered.**
**Keltner Chart**

**Saty Ribbon Chart**
**How to Execute the Trade in ToS**
To execute the trade, you go into the options chain and typically right click to select “Sell” and among the choices will be a “Single,” “Butterfly,” “Iron Condor,” and in this case “Vertical.”
Most platforms will default to the most precise strikes on either side of your target, but you can easily change them. I adjusted mine to give me a 10 point spread. As with any spreads, the wider the spread, the less precise you need to be, but the more it will cost you, or in the case of a credit, pay you.
**My Entry – Sell 3980 ($6.00), buy 3990 ($1.50) – Total Credit - $4.50** (Again, this is simulated using 9/1/22, just FYI)
Because I normally don’t enter these trades earlier than 3:30-3:40 PM, I was extra cautious in case the bulls decided to come for 3980 again. Because of this, I bought back a portion of my credit for $1.50
**Exit – Part 1**
The bulls did indeed attempt to come for 3980 again, as you can see from the chart above, but because I’d already booked profit of 66%, I decided to let the remaining position cash settle, which is the ultimate goal of the trade.
**Exit – Part 2**
If I had let the entire position expire worthless, I would have made a 100% profit. Instead, it was like 85% because I sold off early to protect my winnings.
Hope this helps. Please holler with questions!
A much more detailed explanation can be found here: https://optionalpha.com/strategies/bear-call-credit-spread#:~:text=Bear%20call%20spreads%20are%20also,plus%20the%20net%20credit%20received.
P.S. - This inverse of this trade is a Put Debit Spread, which is bullish, so if you're moving the other direction, you'd just sell puts instead of calls going into close with the same intent, but the opposite bias.
P.P.S - Keep your finger on the trigger for these trades. They move FAST! Haha.

5m candle at 8am
Price action will move opposite of the wick….the
longer the wick, the bigger the move
Wicks on both sides = chop
Longer wick on one side means it will favor the
opposite side
A lot of questions about LT commons.
Here's one way to do it.
Pick solid companies (I prefer companies that i use that are profitable and likely will remain so despite any macro headwinds). AAPL in the past has been one of my favorites for example.
Nibbles: Nibble slowly. (ex. DCA)
Bites: Bigger bites at key levels and/or when fundamentals show value.
Size: Weekly 13/48 EMA crossover.
Good luck!
AAPL 13/48

NVDA 13/48

MSFT 13/48

GOOGL 13/48

AMZN 13/48

thinkorswim: $TICK
We've discussed this a bunch before
But I thought I'd post the link since we've seen VIX and SPX moving together.
10-20 Normal VIX
20-30 Fear starts setting in
30-50 Panic sets in
Over 50 Crisis mode (2000 Tech Bubble, 2008 GFC, 2020 COVID, 2024 Japan Carry Trade, 2025 Tariffs, etc.)

https://twitter.com/satymahajan/status/1642167528041357312?s=20
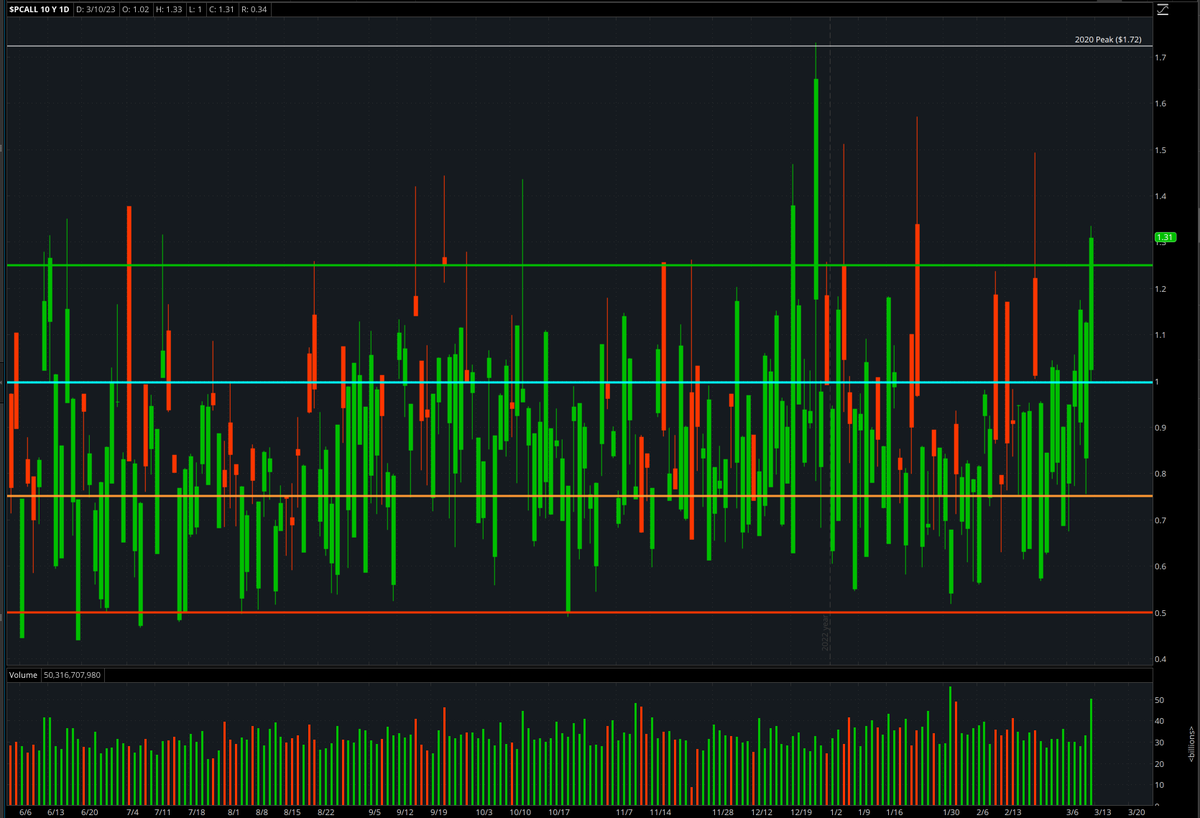
$PCALL on thinkorswim
PC on TradingView
1.25 - Extreme bearish sentiment, time for a rally (calls)
1.00 - Bearish sentiment
0.875 - Neutral
0.75 - Bullish sentiment
0.5 - Extreme bullish sentiment, time for a dump (puts)
Using the daily timeframe
One more piece that is missing from this. Typically JC uses the 10 SMA as the signal. But I generally just eyeball it with candles and use the 8 on the ribbon. Gives a similar result.
I now use the 3 EMA with bars set to grey. I also have another style with 10SMA like JC. I check both.
How I use different Buy/Sell types
Buy Bid - On pullback to entry
Sell Ask - On move into target
Buy Ask - Hold of support/resistance entry
Sell Bid - Support/resistance target exit
Buy Market - Pretty much never
Sell Market - Oh shit I messed up and need to get out (rarely)

Some of my notes on volume and OI

**Entry/Trend/Bias
**
3/10/H Day Trading
10/H/D Swing Trading
H/D/W Position Trading
No matter what you trade, you should always look at the Daily and Weekly timeframes regularly.
**SPX**
The actual S&P 500 index. You should always have this chart available. ATR Levels important. Ribbon will show without pre-market, which can be helpful for mean reversions. Easier to spot gaps.
You can trade options on SPX, but there is no underlying stock.
**ES / /ES / ES1**
The S&P 500 Index futures. Very liquid, widely used to chart and to trade. Excellent levels on TradinView. Gives you access to pre-market data and trend. However, due to the nature of futures, the contract rollovers will make keeping track of a direct relationship with SPX tricky as it will start further away and then get closer toward expiration
You can trade futures directly or options on ES.
**SPY**
The most liquid options chain of S&P 500 tickers. SPY along with VOO is used by investors to buy and hold the S&P 500. It is pinned to SPX. Great levels and pre-market trend. However, on TradingView, you are missing a lot of the pre-market session (tos doesn't have this issue). So for TradingView, I recommend using ES or SPX500 or US500 for trend data
You can trade the ETF directly by buying/selling common stock or trade insanely liquid options (0.01 spread typical).
**SPX500 and US500**
On TradingView.
FOREX tickers for S&P500. Not widely traded. Good levels. Good trend. Fine for use instead of ES or SPY on TradingView.
SPX500 doesn't have any volume.
US500 does.
**Which ones to use**
*thinkorswim*
SPX and SPY
*TradingView*
SPX and ES (or SPX500/US500)
Can use SPY for levels, but data will not be complete for ribbon and oscillator.
ES requires a data package
**SPX/SPY**
SPXL - Long
SPXS - Short
**QQQ**
TQQQ - Long
SQQQ - Short
**IWM**
TNA - Long
TZA - Short
**Semiconductors SOXX/SMH**
SOXL - Long
SOXS - Short
**Calls**
Price - Strike = Settlement
ex. You have 5000c and SPX closes at 5025
5025 - 5000 = 25 Settlement (or $2500)
**Puts**
Strike - Price = Settlement
ex. You have 5000p and SPX closes at 4975
5000 - 4975 = 25 Settlement (or $2500)
Monitor contracts as the Volume changes on thinkorswim or Unusual Whales.
Step 1: Add the SPX watchlist
This only contains SPX. If you add anything else to this list, the scanner will also look at those contracts. Leave as just SPX.
http://tos.mx/tCTLwps
Step 2: Add the SPX 0dte Leaderboard Scanner
You can set this as a watchlist to get the leaderboard.
http://tos.mx/T7WWetg
Step 3: If you trade after hours or pre-market you can use the SPX 0-1dte Leaderboard Scanner to show contracts overnight.
http://tos.mx/DtrHQ9p
Once you load the watchlist it may not have all the columns you see here.

You can click the settings for the watchlist

And select Customize...
Then set up your columns like this and add anything else you want.

For Unusual Whales you can use this filter on Hot Chains.
Contract Volume Leaderboards
**SPY**
1. Add the SPY Watchlist
http://tos.mx/vY63The
2. Add the SPY Leaderboard
http://tos.mx/APDce5v
3. Alternatively, if you have Unusual Whales, you can use this Hot Chain Filter
https://unusualwhales.com/hottest-contracts?limit=250&max_dte=0&order=volume&order_direction=desc&ticker_symbol=SPY
**QQQ**
1. Add the QQQ Watchlist
http://tos.mx/49P7QWL
2. Add the QQQ Leaderboard
http://tos.mx/ATURxof
3. Alternatively, if you have Unusual Whales, you can use this Hot Chain Filter
https://unusualwhales.com/hottest-contracts?limit=250&max_dte=0&order=volume&order_direction=desc&ticker_symbol=QQQ
**IWM - Note IWM doesn't have 0 dte everyday, so I've included 1 dte**
1. Add the IWM Watchlist
http://tos.mx/XC4JSZS
2. Add the IWM Leaderboard
http://tos.mx/GJjZT22
3. Alternatively, if you have Unusual Whales, you can use this Hot Chain Filter
https://unusualwhales.com/hottest-contracts?limit=250&max_dte=1&order=volume&order_direction=desc&ticker_symbol=IWM
Learn it. Live it. Love it!


Jesse Livermore’s Rules of Trading from 1940
Checklist before I take a trade:
1. What is the setup/thesis?
2. What’s my trigger?
3. What’s my entry?
4. What are my exits?
5. What is my technical stop?
6. What is my sizing based on risk, entry, and stop?
$1000 Account
Say your R is 10%. You are willing to risk 10% of account on a single trade.
10% Risk is $100
There are many ways to play the risk with different position sizes.
You can buy 1 contract for $100 and no stop
You can buy 2 contracts for $100 and use a 50% stop
Or you can buy 5 contracts for $100 and use a 20% stop
Or you can buy 10 contracts for $100 and use a 10% stop
Or you can determine your technical stop level, figure out the approx % away from your entry that is, and size accordingly.
In order for risk management to work your winners have to be bigger than your losers. Part of that will be your execution (entry/profit taking) and some will be your setups/system.
When you get to certain profit levels, you can take off position (with multiple contracts) and/or move stops up to breakeven and then into profit. This is personal. I tend to like to take profit off at 25%, 50%, 100%. For SPX, 50%, 100%, 200%. However, regardless of % gain, if strong support (puts) or resistance (calls) is met, I will consider moving stops or taking profit.
90 days of Day Trading
1 ticker (SPY is always a good choice)
1-2 setups (ideally just 1 to start)
1 contract ATM 1+ dte
Focused entry
Exit at base hit or when risk is hit
No trade to 3 MAX per day (ideally 0-2)
This will define the trader you are now (or the trader you want to be). Keep this with you on your desk as you trade as a reminder. And then relentlessly focus on becoming this trader and getting better at being this trader.
**What is My Trading Identity?**
*What tickers work best for me?*
1-3 Tickers (ideally 1 or 2, no more than 3)
*What instruments work best for me?*
Equities, Options, Futures, FOREX (pick 1 to start)
*What setups work best for me?*
1-2 Setups to start (Ideally 1 you can master)
How can you win only 1 of 3 trades and still be green?
Winners need to be big.
Losers need to be small.
Risk needs to be managed.
Account = $2000
R = $100 (5%)
T1 = +3R = +$300
T2 = 0R = -$0 (B/E cut)
T3 = -1R = -$100
Account = $2200 (+10%)
1. Find your top favorite 10 tickers
2. Review each of them for the last 100 days with ATR Levels Day Mode
3. Realize FOMO is stupid and there is always another play.
From our book of the month: Trading in the Zone, by Mark Douglas

Manage your emotions effectively and you will become a successful trader.
* Re-Read The 5 Fundamental Truths and the 7 Principles of Trading Consistency from Trading in the Zone.
* Are you overly worried about this play? Get out and move on.
* How are you feeling right now? Angry, frustrated, lost, or anxious? Take a break and get some perspective.
* Did you lose your last trade? Did you lose big? Are you angry and frustrated looking to revenge trade? Your job is to preserve capital. You are only fighting yourself. Step Away. Trade again tomorrow.
* Are you trying to risk too much to cover your loses? Stop! Don’t do it. You will blow up your account. These are your emotions controlling you.
* Are you being greedy? Take your profit if you are winning. Small gains compound into big gains.
* Are you feeling FOMO? Are you watching a stock spike and want to get in? Remember last time you lost big chasing. It is not worth it. There are always great plays.
* Have you lost big for the day? Step away. Trade again tomorrow.
* Have you won big for the day? Step away. Trade again tomorrow.

This may not play in discord. You may need to download it in order to play it.
Some expressed interest in learning my daily meditation routine. My father, who learned from his father, taught me this when I was 8. I did it off and on when I was young but I have been doing it more or less every day for the last 22 years.
1. Find a quiet spot
2. Sit with your back straight
3. Close your eyes.
4. Breathe. Focus on breathing.
5. Any time your mind wanders, refocus on your breathing. Be ok with thoughts and emotions, just don't let them influence you. Re-focus on breathing.
6. Work up to 2 x 20 minute sessions each day (morning and before bed).
Jocko is a former officer in the Navy Seals
Read this article: https://www.investopedia.com/articles/technical/112601.asp
Practice on each chart in the S&P 500.
Use a Clean Daily chart.
Find the following:
Trendlines
Boxes
Wedges
Triangles
Pennants
Channels
Flags
Cup and Handles
Double Bottoms
Double Tops
The h pattern is a price action pattern where you have a large drop in price followed by a small recovery and then retest of the recent lows. The support at recent lows then can remain as support, often resulting in a double-bottom reversal, or broken, resulting in continuation to the downside.


In this example from SPY today, you can see we had a retest of the ribbon, followd by a strong move to the downisde, recovery to the ribbon, a retest of lows, which were broken, resulting in continuation.
Also of note, often the 'recovery' porition of the h pattern, after the big drop, can form a bear flag.
Some additional resources on the h pattern:
The easiest way to play the 'h' pattern is to look for a break or bounce of the support level.

Today was a good example of how understanding some basic structure can help you identify trend without having to rely on (or wait for) Moving Averages (MAs) to show you the way. While we love MAs and they provide a ton of utility, It's useful to understand how to measure trend with price. Price is real-time. MAs are lagging. For example, an 8-period moving average value requires the previous 8 candles to calculate. So it lags by 8 candles.
Key for the example image.
Higher High (HH) then Higher Low (HL) = Uptrend
Lower Low (LL) then Lower High (LH) = Downtrend
Equal High (EH) then Equal Low (EL) = Box/Consolidation/Sideways
Transitions / Trend change occurs when you start to shift from one of the above patterns to something new.
Note you can even spot common technical patterns using the above concepts:
Head and Shoulders is a HH then HH then LH .
Inverse Head and Shoulders is a LL then LL then HL.


Using Structure to Identify Trend without Moving Averages
Excerpt from Martin Pring's great book on Technical Analysis.


Investopedia articles
Good 3rd party diagram showing various types

Something I've been playing with recently is a theory that 8/48 conviction arrows provide nice support/resistance levels often valuable for continuation or reversals. I am working on automating this for you, but am sharing early so you can experiment.
To get started change your fast conviction EMA to 8 instead of 13 (you can also use 13 if you prefer, but will be a slightly different outcome).
Wait for the candle close on a convicton arrow print. then:
When you get an up arrow, draw a level at the candle high.
When you get a down arrow, draw a level at the candle low.


Above are examples from the past couple days and here is an example from today's afternoon breakout

Can be used on any timeframe. I generally follow this:
3m - Scalps / EOD SPX
10m - Day trades
30m/H - Near-term Swings
4H/D - Swings
W - Position trades / LEAPS
M - Investments
**Dots**
Black = Low Compression Squeeze (Squeeze Pro only)
Red = Normal Squeeze
Orange = High Compression Squeeze (Squeeze Pro only)
Green = Squeeze Fired
**Momentum Bars**
Light Blue - Increasing Bullish Momentum
Dark Blue - Decreasing Bullish Momentum
Red - Increasing Bearish Momentum
Yellow - Decreasing Bearish Momentum
**Ideal Bullish Setup**
Above 21 EMA
Ribbon Bullish (stacked EMAs up)
Momentum above 0 and rising
Red Dots (preferably 5)
**Ideal Bearish Setup**
Below 21 EMA
Ribbon Bearish (stacked EMAs down)
Momentum below 0 and falling
Red Dots (preferably 5)
Here are some Time Warp and Levels examples
3m timeframe
10m Time Warped Ribbon
Day Mode + All levels

For thinkorswim users who scalp SPX
1m timeframe
3m Time Warped Ribbon
Scalp Levels + All levels

Love this one as well. Showed this ES chart in the morning. Look where we ended
1h timeframe
1D Time Warped Ribbon
Swing Levels + All levels

10m timeframe
1h Time Warped Ribbon
Day Levels with All Levels

For those of you that have purchased RAF, this is in the Simpler Portal. Adding it here for your reference.

**Big Picture**
Timeframe: M
ATR Levels: None
Pivot Ribbon TimeWarp: None
Phase Oscillator
Volume Stack
**Long-term**
Timeframe: W
ATR Levels: Long-term Mode (Yearly levels)
Pivot Ribbon TimeWarp: None
Phase Oscillator
Volume Stack
**Position**
Timeframe: D
ATR Levels: Position Mode (Quarterly levels)
Pivot Ribbon TimeWarp: None
Phase Oscillator
Volume Stack
**Swing**
Timeframe: H (Regular Trading Hours - RTH)
ATR Levels: Swing Mode (Monthly levels)
Pivot Ribbon TimeWarp: None
Phase Oscillator
Volume Stack
**Swing H/D + RTH**
Timeframe: H (Regular Trading Hours - RTH)
ATR Levels: Swing Mode (Monthly levels)
Pivot Ribbon TimeWarp: D
Phase Oscillator
Volume Stack
**Multiday**
Timeframe: H (Extended Trading Hours - ETH)
ATR Levels: Multiday Mode (Weekly levels)
Pivot Ribbon TimeWarp Default: None
Phase Oscillator
Volume Stack
**Day**
Timeframe: 10m (Extended Trading Hours - ETH)
ATR Levels: Day Mode (Daily levels)
Pivot Ribbon TimeWarp Default: None
Phase Oscillator
Volume Stack
**Day 3/10**
Timeframe: 3m (Extended Trading Hours - ETH)
ATR Levels: Day Mode (Daily levels)
Pivot Ribbon TimeWarp Default: 10m
Phase Oscillator
Volume Stack
**Day RTH**
Timeframe: 3m (Regular Trading Hours - RTH)
ATR Levels: Day Mode (Daily levels)
Pivot Ribbon TimeWarp Default: None
Phase Oscillator
Volume Stack
**Scalp**
Timeframe: 3m (Extended Trading Hours - ETH)
ATR Levels (thinkorswim): Scalp Mode (Intraday levels)
ATR Levels (TradingView): Day Mode (Daily levels)
Pivot Ribbon TimeWarp Default: None
Phase Oscillator
Volume Stack
All indicators are free on satyland.com
These are the data packages that you may wish to add if you are using TradingView
1:1 match with thinkorswim SPX data

ES/MES/NQ/MNQ/etc Futures Real-Time Data

Stock Market Data for all tickers (note you can pick subsets of this, but they bundled everything at a lower price than buying more than a few)

**SPX 0dte $100k+**
https://unusualwhales.com/live-options-flow?expiry_dates%5B%5D=2023-01-06&intraday_only=true&issue_types%5B%5D=Common%20Stock&issue_types%5B%5D=ADR&issue_types%5B%5D=Index&limit=50&max_dte=0&min_premium=100000&ticker_symbol=SPXW
**SPX 0dte $50k+ OTM Only**
https://unusualwhales.com/live-options-flow?expiry_dates%5B%5D=2023-01-06&intraday_only=true&is_otm=true&issue_types%5B%5D=Common%20Stock&issue_types%5B%5D=ADR&issue_types%5B%5D=Index&limit=50&max_dte=0&min_premium=50000&ticker_symbol=SPXW
**SPX 0dte $25k+ Size > OI**
https://unusualwhales.com/live-options-flow?expiry_dates%5B%5D=2023-01-06&intraday_only=true&issue_types%5B%5D=Common%20Stock&issue_types%5B%5D=ADR&issue_types%5B%5D=Index&limit=50&max_dte=0&min_premium=25000&size_greater_oi=true&ticker_symbol=SPXW
I use this filter to scan for the next 31 dte, $250k+, OTM and Single Leg. Sorted by Time. https://unusualwhales.com/live-options-flow?is_multi_leg=false&is_otm=true&limit=250&max_dte=31&min_dte=0&min_premium=250000&order=Time&watchlist_name=Big%20Bets
Using the trend on the oscillator is very powerful. Started using it recently.

1. I have found on systems with 16GB or more that setting your memory 512 - 6122 has worked best for me. For 8GB you can use 512 - 3072. You can change this setting by closing thinkorswim on desktop and using the settings gear icon to change the memory setting. Save and you will restart thinkorswim with the change. You can then login.

2. As long as you have a modern PC/Mac with a decent internet connection, turning on real-time data quotes can help tremendously when scalping or for EOD trades. You can access this from the Setup button in the top right of tos > Application Settings > System. Set Quote speed to Real-time (no delay)

3. I've found that 2GB - 6GB has given me the best on 16GB+ systems
Mac: Cmd + Shift + 4 (Cmd + Shift + 3 for the fullscreen, Cmd + Shift + 5 for video)
Windows: Windows + Shift + S
Setup -> Positions
If you change from Instrument to Order in Setup, then on the Monitor tab your spreads will all be nice and organized and you can manage them more effectively (closing positions, etc.)

I have found this video to be invaluable in having a simple model for the economy. Ray has a simple style that is very approachable. The motion graphics are A+. I re-watch this video regularly.
Very configurable. The app is pretty decent as well.
Tomorrow is OPEX and Quadruple witching. Sounds ominous but it just means we have simultaneous expirations across multiple markets. Read more here: https://www.investopedia.com/terms/q/quadruplewitching.asp
As a recent SPX trader, I wanted to better understand how SPX behaves on any given day, specifically 0 DTE. My goal was to identify any trends or insights that might help with my conviction as I make trades. So, I downloaded the entire history or SPX and went to work. You can find that data `https://www.wsj.com/market-data/quotes/index/SPX/historical-prices`.
Because I’m only concerned with 0 DTE, Open price and Close price are the most important to understand, but recognizing the High and Low price is also important. I studied the data going back to 1978, but for the purposes of this lesson, I’m only concerning myself with the last 5 years of data. You could make the case that going back further is useful, but with algorithmic trading being so prevalent, I think it makes more sense to focus on a time period that’s recent and has had a black swan event (Covid) to ensure that outlier events are accounted for.
With that in mind, here’s what the data is telling me:
**In the last 5 years:**
The largest positive move from Open to Close:** 141.03** on **3/13/20**
The largest negative move from Open to Close: **-150.22** on **3/12/20**
The biggest swing between High and Low on any day: **218.96** on **3/13/20**
Total number of times price has moved +100: **5 or 0.40% of all trading days.**
Total number of times price has moved +125: **3 or 0.24% of all trading days.**
Total number of times price has moved +150: **0 or 0.00% of all trading days.**
Total number of times price has moved -100: **11 or 0.89% of all trading days.**
Total number of times price has moved -125: **4 or 0.32% of all trading days.**
Total number of times price has moved -150: 1 **or 0.08% of all trading days.**
There are a number of insights you can glean from this, but my biggest takeaway is that the market craves predictability, even on it’s messiest days. Take **3/13/20**, where we had our wildest swing from Highs and Lows in any day. The market still ended up only **+141.03. **
It also tells me that the likelihood of a massive move that stays massive is highly unlikely, so if I see the market extend in either direction and premiums are still high (IV up), I can feel confident selling premium in the + or – 100-150 range, knowing that it will eventually come back to reality before the day closes.
Hopefully this helps and please let me know if you have any questions in my DMs.
More details for anyone who's interested:

From this, it's clear that even in the worst circumstances from the past 50 years, and especially in the last 5-10 years (probably because of algos), the market does not like to move a lot on any given day without finding it's footing again before close.
In fact, it's only opened and closed +/- 5% 4 times total in the last 10 years. The market seems more comfortable with a +/-3% close, around 0.64% of trading days in the last 10 years, or 1.05% in the last 5 years.
This quick study is for all December moves between 1998 - 2021

**Up **- 16 times
**Down **- 5 times
**Mixed **- 3 times
**Largest Move Up** - 10.66% in 2008
**Largest Move Down** - -10.16 in 2018
Bearish Day Mode - Below put trigger
Bullish Day Mode - Above the call trigger
Bearish Bias - Below BOTH multiday previous close and swing put triggers
Bullish Bias - Above BOTH multiday previous close and swing call triggers
And if you look at the actual scans you'll see the parameters to set up where along the levels the scan finds things is completely flexible. So you can tune it however you want. Or come up with millions of different scans in conjunction with other studies.
Super useful scanner you can create really easily with thinkorswim or FinViz. Just take S&P 500 (or point at your watchlist in tos) and have it sort by volume (highest to lowest).

Here's a version for thinkorswim that is scanning the entire market: http://tos.mx/sOXj4BB
Everyone should read Trading in the Zone by Mark Douglas this month. We can discuss your questions in <#973956271390740494>. I consider this book to be essential reading for any trader who wants to succeed. Discipline and managing your psychology is harder to master and much more influential on your trading than your process for finding and executing trades.
September 1st, so that means a new book to read and the second in our three-part foundational series. The first book was Trading in the Zone by Mark Douglas. So if you haven’t read it, I recommend reading that one first.
This month’s book is Volume Profile Analysis by Anna Couling. It’s a short but powerful read and will transform the way you look at price and volume.
Book of the Month (September) - Volume Profile Analysis
This month's book will help you understand market internals and setups like the Squeeze even better. We will build on top of the great foundation of Trading in the Zone (Psychology/Emotions/Discipline) and Volume Price Analysis (Price, Volume).
This month's book is all about how not much has changed in 100+ years of the market. I think you'll love this one. It is a classic.
We will continue our Q1 theme of risk management, emotions, and mindset. The book of the month for February is The Mental Game of Trading. This book provides actionable tactics to help you with your psychology. https://www.amazon.com/Mental-Game-Trading-Confidence-Discipline/dp/1734030917/ref=sr_1_1?keywords=the+mental+game+of+trading&qid=1675115806&sprefix=the+mental+game%2Caps%2C95&sr=8-1
You can use Rayner Teo for charting techniques or get Pring's TA book. This TA book is a modern view of TA including some basics, risk management, setups, and more. It should tie together a lot that you've learned from the past books of the month. Hope you enjoy it. https://www.amazon.com/Art-Science-Technical-Analysis-Strategies/dp/1118115120/
This is an article that appeared two decades ago in a magazine. Many of the ideas in here influenced me and I adapted some of these rules for my own system as you will see. Enjoy!
This one comes recommended from Morpheus! https://www.amazon.com/Zen-Trader-Peter-Castle/dp/0857198262?nodl=1&dplnkId=87f9e92d-e5c4-4a7d-84ee-061c147c0940
This book popularized candlestick patterns. Great read and reference. https://www.amazon.com/Japanese-Candlestick-Charting-Techniques-Second/dp/0735201811?nodl=1&dplnkId=209d251e-d2db-4436-b1fb-c966f08d53b4
One of our core books and an important read. Many of you have read it already, worth a review.
https://www.amazon.com/Complete-Guide-Price-Analysis/dp/1491249390/ref=sr_1_1?crid=1ZG6X25NYHN3E&keywords=volume+price+analysis+by+anna+coulling&qid=1698844061&sprefix=volume+price+%2Caps%2C85&sr=8-1
We’re going to take a break from emotion and technical analysis to read about a very famous trader who “discovered” one of the most important ideas in modern trading: The Darvas Box. This is the story of Nicolas Darvas and how he made $2M in the 1950s trading overseas via Telegram (not the app). It’s a super fun story and you’ll gain additional appreciation for simple strategies that give you an edge. Enjoy!
THIS I AWESOME!
Highlander / EOD Compilation
Do you have a write up of the TGIF, and 100K strats? Thanks.
Great job. This compilation of Saty's work has been invaluable in helping me to see the whole picture in a very understandable format. Thanks for sharing your work.
not a write up but I did comb through the chat and put up a compilation of items about EOD, 100k, and Highlander. I am new to those. First time I traded it was last Friday and man...that wasn't good. LOL
glad it helps. I need to study it more as I'm doing better swing trading than I am day trading. I didn't make these to be a "cheat sheet" but to be used when people review the videos again. It's like watching a movie over and picking up something different that you didn't see before. 🙂 I wish you much success on your trading.
I wanted to reorganize these and they are in no particular order. They ARE TO BE USED while watching / rewatching Saty's videos. Just my notes that I took when viewing so thank Saty and Morpheus, Tesrak, Ben, Tyler, and others.
SATY ATR Levels with Update
SATY ATR Levels Day Trading Strategy
SATY Pivot Ribbon
SATY Phase Oscillator
SATY Overview Putting it All Together
The VOMY Setup
The Golden Gate Strategy
The Squeeze (TTM Squeeze)
Mastering The Squeeze
Sanity Checking Strikes & Expirations Using SATY ATR Levels
Scalping & Day Trading SPX & SPY with Time Warp
Scanner - Build an Option (Volume) Leaderboard
Making a SPY Day Trade Plan & Mulit Time Frame to Build a Thesis
Probability and Stats per Tezak
Tips and Tricks also SATY Mantra
Highlander Strat Notes and Chat
Wah. <@198236190133059584> … amazing work putting these pdfs together.
Thanks
how cool is this!! thanks
Thank you
Thank you for such an amazing in-depth work!
Thank you so much for this! Using these notes in addition to rewatching the videos has cleared up a lot misunderstandings for me! This is great!!
Thank you so much for these PDFs. Really appreciate it!
I am new to the discord and I literally stayed up most of the night studying these pdf’s…amazing resource. Can’t thank you enough <@198236190133059584>
Watch the videos too.
They synergize each other.
<@198236190133059584> Just found this and thank you so much for the content! ☺️
no problem. Hope this helps.
These are great thanks!
This is gold! ty
Any notes on divergence?
I literally printed these notes out into a book ! Sooooo helpful

Thanks for sharing these!
Thanks for these recap! <@1094480760829902949> always nice to see traders thought process
Thanks <@1094480760829902949>
When you say retest closed above YDL for QQQ. Wouldn’t entry be on the retest? What do you define as “clearly close under” ?
Ik I poke fun at you for taking a bunch of trades but the recaps have honestly been so helpful. Seeing someone just trade a system consistently is very helpful.
Entry can be retest, risk is still 10/13
Chose to wait 10/13 for entry
Theyre not just a bunch of trades tbh, they all have a thesis with them 🙂
the time warp on you chart is 10 min on a 3 min chart?
Thanks
<@1094480760829902949> what does max bull or max short mean? or long bias vs max bull?
its in reference to the weekly and daily highs and lows and ribbon
above weekly high + daily high + trending 1h and 10m bull = max bull
Thank you for sharing these. Qq, how do you select which mag7 tickers to play for the day?? Also do you always use 5m chart instead of 3m
quick scan in the morning
check through 4h 1h 10m
and then look at levels
When do you decide to use 5 min vs 3 min? How do you decide if the key level/ema will act as a wall and you can enter on the first touch vs entering on a reclaim/retest or break of previous candle lows/highs.
Are you watching all of these positions at the same time or just setting alerts/bracket orders?
Thank you 🙏
@kk313 - I am new to this group. In your chart there are levels as YDL, LML. Are those determined manually for each ticker or any script available for it. I use TOS wondering any script available so can use it.
this is it i believe. can confirm it's a huge help!
ah sorry you said TOS - not sure the equivalent there, but i bet it's available somewhere
Thank you.
<@890433057717366846> here is a good one for TOS. I use a variation of it. This one does not include prior week or month highs and lows but you can have one of the ai tools add those levels for you. I might modify
https://usethinkscript.com/threads/previous-day-high-low-close-premarket-high-low-high-low-open-of-day-atr-lines-for-thinkorswim.13139/
you can add prior week high/low with this code...copy it in to your script
#----- START Previous Week High/Low -----#
def weekAggregationPeriod = AggregationPeriod.WEEK;
plot PW_High;
plot PW_Low;
if showOnlyLastPeriod and !IsNaN(close(period = weekAggregationPeriod)[-1]) {
PW_High = na;
PW_Low = na;
} else {
PW_High = Highest(high(period = weekAggregationPeriod)[-displace], length);
PW_Low = Lowest(low(period = weekAggregationPeriod)[-displace], length);
}
PW_High.SetDefaultColor(Color.dark_green);
PW_High.SetPaintingStrategy(PaintingStrategy.POINTS);
PW_High.SetLineWeight(2);
PW_High.HideTitle();
PW_High.HideBubble();
PW_Low.SetDefaultColor(Color.dark_red);
PW_Low.SetPaintingStrategy(PaintingStrategy.POINTS);
PW_Low.SetLineWeight(2);
PW_Low.HideTitle();
PW_Low.HideBubble();
#----- END Previous Week High/Low -----#
I'll probably update mine to add prior week and prior month levels, so can share here when I do it (probably this weekend).
Thanks so much for your help.
I'll move that comment somewhere else tomorrow because it's not really relevant to this forum which is for <@1094480760829902949> to post recaps.
Thanks <@642481217098481664>
<@1094480760829902949> hello KK, you have mentioned which app you use to take notes in the past but I forgot. Can you remind me? I need to do this.
Notion 🙂
<@1094480760829902949> looks like lately all your recaps are 5/10, have you stopped using the smaller timeframes like 1/3?
Still use 1/3 for entries, but will always take the play based on 5m + 15m PA
is that the 15m tw on the 5 then? so, you identify the trade on the 5/15, then drop to the 1/3 to find an entry against the 3m that aligns with the identified trade?
asking because i feel like i'm spending a lot of time staring at the 1/3 and it's not going well.
<@860155758183972865> note talked about the hourly pop
Thank you
if the recaps r helpful for u guys ill post them here again
they are. Thank you for sharing 🤝
What are your 'key levels' for key level longs and shorts?
more thoughts here
so as not to plague chat
the reason this set up worked so well
look at previous 3 days
we had outsized dips to the 5m 48 10m 21
what you wanna do here is NOT look for a vony
vomy
until the 10m 48 has broken down
what you do wanna look for is seller exhaustion and bullish participation in the form of a bullish inside bar
and then confirmation above said bullish inside bare
along with reclaim of trend
to allow for a push higher
Thanks KK, I am going through all of these to learn your methods. You are crushing it.
The bias from your notes combined with your explanations on the way you read PA is super helpful. You're very good at looking at the right things in the moment. I am slowly simplifying my charts and what I look at when I trade.
<@1094480760829902949> when you enter positions on key levels or emas are you usually entering all at once on a limit order or do you wait to see if it goes through and reclaims or are you waiting for confirmation? Or are you starting with small position then scaling in with confirmation? I'm guessing its situational but would like to know the "standard".
Enter on test of support, add more with confirmation, scale out at base hit, scale for 50% then trail stop
<@1094480760829902949> could you share your HTF projection settings?
is that the LuxAlgo verison of script?
Monday
ya
tuesday
Still waiting on this
Thank you!
Do you put a lot more weight on inside bars in the direction of trend? If emas are stacked bullish and you see an inside bearish bar is that a signal to just be careful/watch from the sidelines?